Call Us Today (949) 379-6250

Sexual harassment is a pervasive and harmful reality that affects millions of workers across the United States. Workplace sexual harassment can take many forms such as, unwelcome sexual advances, requests for sexual favors, and other verbal or physical harassment of a sexual nature. It can also take the form of harassment based on that person’s sex, such as offensive remarks about a person’s sex in general. The effects of workplace sexual harassment can impact workers’ job performance, mental health, and general happiness and security.
Below, we will explore various statistics about sexual harassment in America’s workplaces that will reveal the prevalence and seriousness of this issue. By better understanding the data and the different forms of sexual harassment in the workplace, we can foster a workplace culture that respects the rights and dignity of all employees, free from the detrimental effects of sexual harassment.
Quid pro quo harassment occurs when a person in a position of power or authority demands sexual favors or engages in unwelcome sexual advances in exchange for employment benefits, promotions, job security, or other favorable treatment in the workplace. The term “quid pro quo” translates to “something for something,” illustrating the exploitative nature of this type of harassment. In quid pro quo harassment, the harasser typically holds the power to grant or deny workplace opportunities or advantages, creating a coercive dynamic that leaves the victim feeling pressured, intimidated, or fearful of negative repercussions for refusing or reporting the advances.
Unlike quid pro quo harassment, which involves explicit demands for sexual favors in exchange for employment benefits, hostile work environment harassment can involve a pattern of ongoing behaviors, comments, or actions that create an atmosphere that is hostile, abusive, or sexually intimidating
Sexual harassment in America affects individuals of all genders, but it disproportionately impacts women.
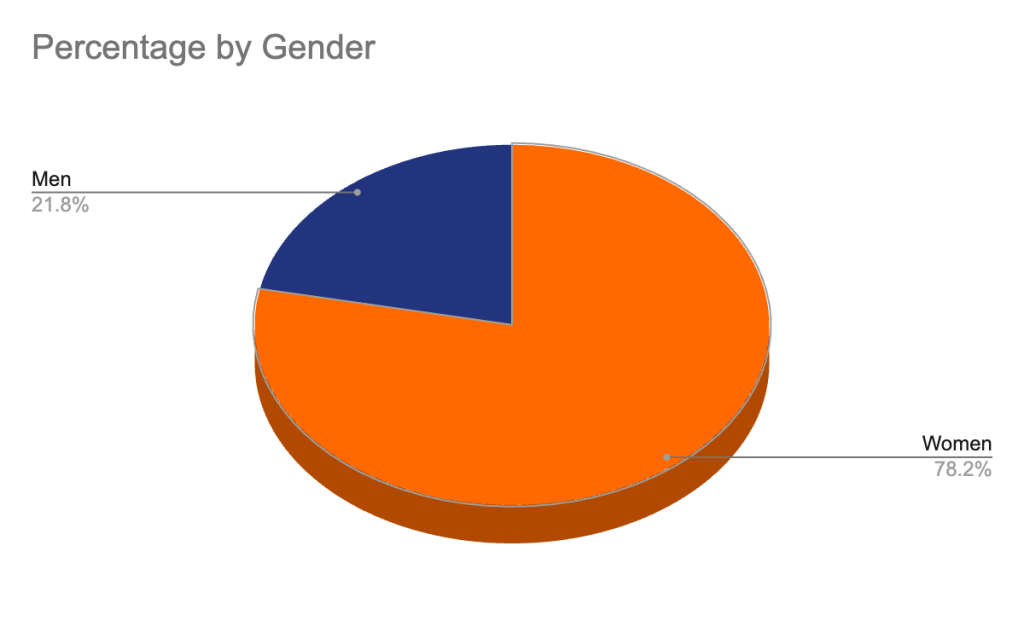
However, it is essential to recognize that anyone can be a victim of sexual harassment, regardless of their gender identity.
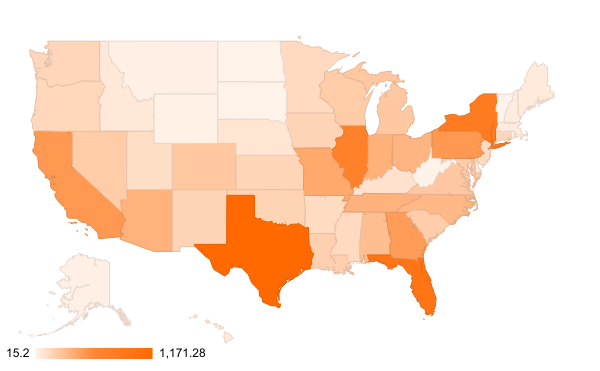
The top 5 States that had the most sexual harassment charges from 1997 – 2021 were:
| Charges Filed Alleging Sexual Harassment, by State Average 1997 – 2021 | ||||||
| 1997-2001 Avg. | 2002-2006 Avg. | 2007-2011 Avg. | 2012-2016 Avg. | 2017-2021 Avg. | 25-Year Avg. | |
| Texas | 1,568 | 1,272 | 1,167 | 960 | 890 | 1,171 |
| Florida | 1,235 | 889 | 953 | 794 | 787 | 932 |
| New York | 873 | 748 | 880 | 792 | 799 | 819 |
| Illinois | 931 | 804 | 709 | 563 | 585 | 718 |
| California | 609 | 464 | 512 | 447 | 491 | 505 |
| Pennsylvania | 663 | 519 | 527 | 395 | 415 | 504 |
| Georgia | 583 | 525 | 460 | 404 | 430 | 480 |
| Missouri | 476 | 437 | 405 | 351 | 390 | 412 |
| Indiana | 556 | 450 | 361 | 286 | 202 | 371 |
| Arizona | 445 | 448 | 374 | 312 | 247 | 365 |
| Tennessee | 418 | 421 | 391 | 303 | 277 | 362 |
| Ohio | 456 | 390 | 351 | 269 | 273 | 348 |
| North Carolina | 388 | 322 | 376 | 293 | 282 | 332 |
| Alabama | 447 | 284 | 306 | 248 | 215 | 300 |
| Virginia | 278 | 240 | 272 | 243 | 209 | 248 |
| Colorado | 318 | 240 | 250 | 212 | 214 | 247 |
| Michigan | 199 | 266 | 290 | 248 | 230 | 247 |
| Wisconsin | 294 | 260 | 207 | 174 | 186 | 224 |
| Nevada | 220 | 242 | 236 | 209 | 212 | 224 |
| Maryland | 286 | 212 | 222 | 202 | 183 | 221 |
| South Carolina | 270 | 242 | 206 | 181 | 201 | 220 |
| Louisiana | 281 | 215 | 202 | 154 | 155 | 201 |
| Oklahoma | 212 | 211 | 223 | 162 | 104 | 183 |
| Iowa | 227 | 193 | 175 | 158 | 149 | 181 |
| New Mexico | 217 | 219 | 191 | 153 | 115 | 179 |
| Kansas | 233 | 176 | 173 | 130 | 165 | 175 |
| Washington | 234 | 193 | 155 | 135 | 137 | 171 |
| Connecticut | 212 | 184 | 153 | 132 | 161 | 168 |
| Oregon | 232 | 190 | 149 | 131 | 121 | 165 |
| Minnesota | 228 | 200 | 137 | 98 | 82 | 149 |
| Mississippi | 200 | 131 | 137 | 149 | 125 | 149 |
| Arkansas | 189 | 172 | 138 | 118 | 105 | 144 |
| New Jersey | 190 | 161 | 131 | 113 | 120 | 143 |
| Utah | 156 | 160 | 125 | 119 | 81 | 128 |
| Kentucky | 132 | 124 | 121 | 95 | 72 | 109 |
| Nebraska | 133 | 87 | 72 | 69 | 76 | 87 |
| Idaho | 97 | 92 | 57 | 48 | 74 | |
| Hawaii | 83 | 74 | 73 | 49 | 58 | 68 |
| Maine | 89 | 71 | 54 | 50 | 42 | 61 |
| New Hampshire | 73 | 68 | 41 | 35 | 48 | 53 |
| Massachusetts | 110 | 28 | 37 | 42 | 43 | 52 |
| Delaware | 49 | 75 | 56 | 44 | 30 | 51 |
| Rhode Island | 54 | 43 | 35 | 30 | 27 | 38 |
| Alaska | 41 | 36 | 35 | 40 | 27 | 36 |
| Montana | 46 | 39 | 41 | 21 | 30 | 35 |
| Wyoming | 37 | 34 | 24 | 22 | 22 | 28 |
| South Dakota | 28 | 29 | 23 | 17 | 14 | 22 |
| North Dakota | 17 | 20 | 21 | 29 | 20 | 22 |
| West Virginia | 39 | 23 | 21 | 12 | 8 | 20 |
| Vermont | 26 | 15 | 14 | 9 | 12 | 15 |
It’s important to note that while these 5 states have the most charges over the 25 year span, they are also the states with the highest civilian labor force. The size of the labor force in a state can have a significant impact on the number of reported charges. Larger labor forces generally mean more people working, which increases the potential for incidents of sexual harassment to occur and be reported. Therefore, it is not surprising that these states, with their larger labor forces, would have a higher number of charges compared to states with smaller labor forces.
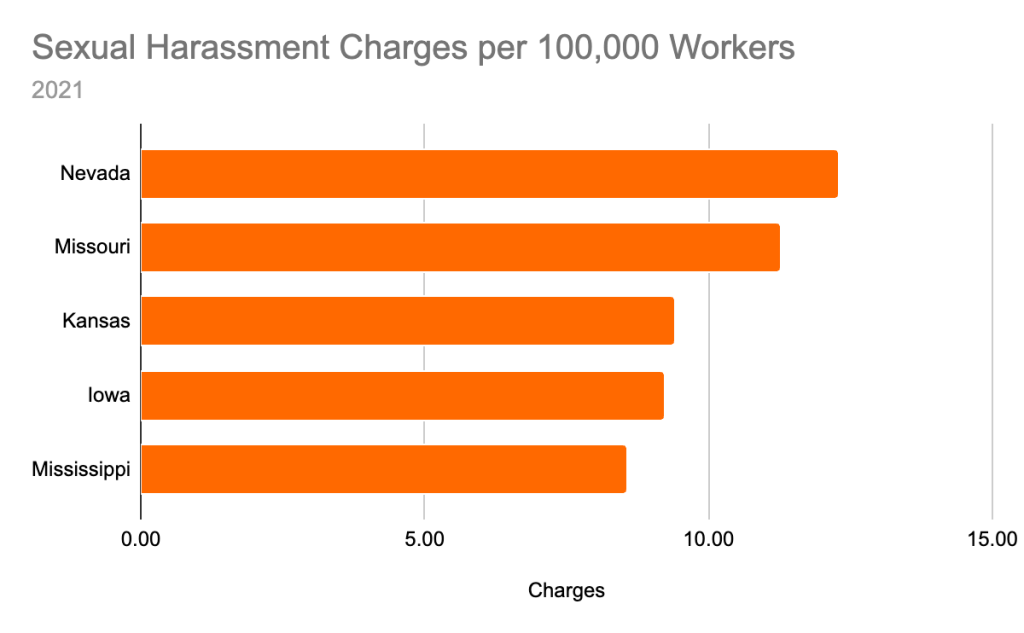
When viewing the 2021 data of total number of charges per 100,000 workers, the top 5 states with the highest rate of sexual harassment charges are:
In a 2018 EEOC survey, of the 4,205 responses to the question “Have you personally encountered sexual harassment in the workplace”
Of those who encountered sexual harassment in the workplace, an astounding 55.50% did not report the incident to anyone. This underreporting phenomenon highlights the complex and challenging dynamics surrounding sexual harassment cases. There are various reasons why victims may opt to remain silent, including fear of retaliation, concerns about not being believed or taken seriously, potential damage to their professional reputation, or a lack of trust in the effectiveness of reporting mechanisms. The consequences of this underreporting are profound, as it perpetuates a culture of silence, allowing perpetrators to go unchecked and leaving other employees vulnerable to similar mistreatment.
Employees who have experienced sexual harassment may fear that if they report the incident, their professional reputation will be tarnished, and they will face negative consequences from their colleagues, supervisors, or employers. Retaliation can take various forms, including adverse employment actions such as demotion, termination, unfavorable job assignments, ostracization, or even blacklisting within the industry. Fear of retaliation is a significant barrier that often deters individuals from reporting incidents of sexual harassment in the workplace.
Sexual harassment in the workplace carries significant costs that extend beyond the immediate experiences of the victims. It can have detrimental effects on both the mental health and work performance of those involved, as well as impose substantial monetary burdens on individuals and organizations.
The impact on mental health is profound. Victims of sexual harassment often experience a range of emotional and psychological consequences, including anxiety, depression, post-traumatic stress disorder (PTSD), and decreased self-esteem. In terms of work performance, sexual harassment can severely disrupt an individual’s ability to focus, engage, and thrive in their professional responsibilities. Victims may experience heightened stress levels, which can impair decision-making, reduce creativity, and impede effective collaboration with colleagues.
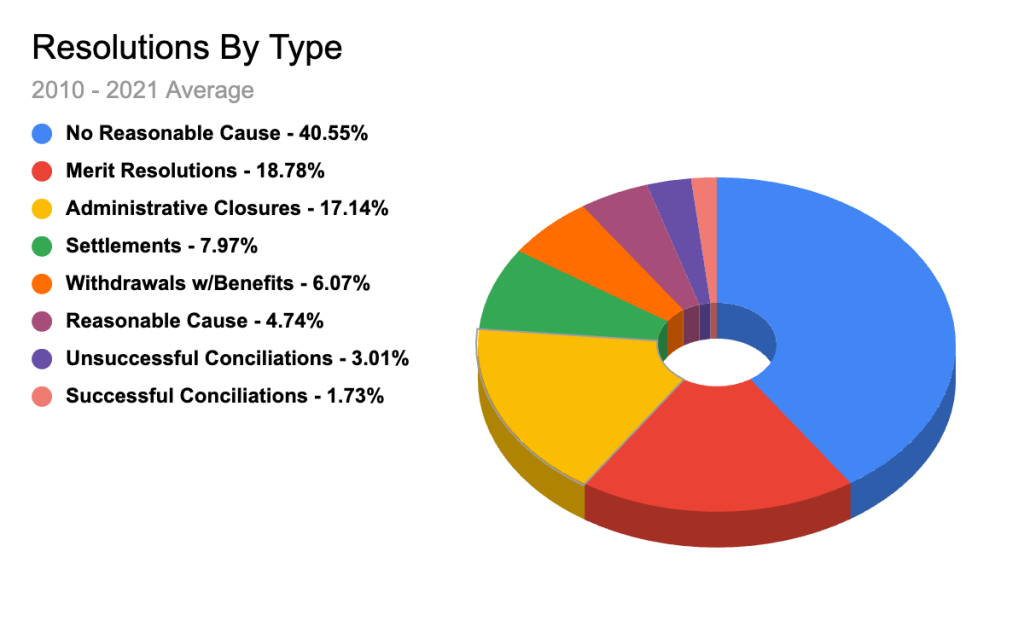
There are some significant monetary costs associated with sexual harassment as well, secured through administrative enforcement as a form of resolution. These various forms of relief include actual cash relief for charging parties or other aggrieved individuals such as restored pay, compensatory damages, punitive and liquidated damages, and other items such as attorney’s fees, fringe benefits, and training or tuition costs. There is also prospective relief that may be included that is associated with the resolution of the charge including hiring, reinstatement, recall or other actions that result in employment for the charging party or aggrieved individuals, as well as promotions and prospective fringe benefits.
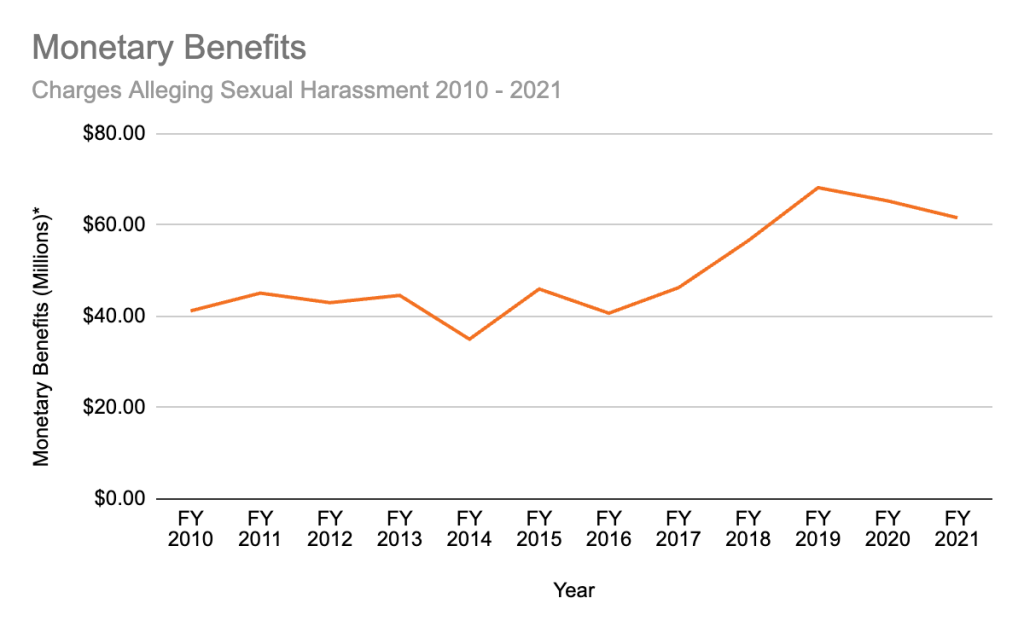
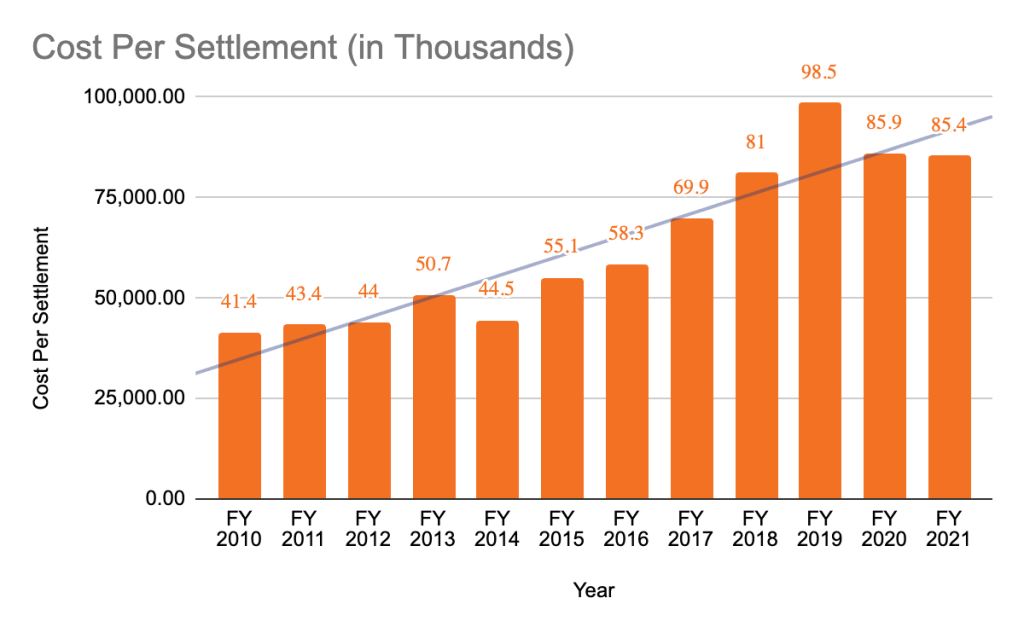
It is important to note that individual settlement amounts can vary significantly based on the specific details and severity of each case. Settlements may cover various expenses, including compensatory damages, attorney’s fees, and other associated costs. This data underscores the substantial financial impact that sexual harassment claims can have on organizations and emphasizes the importance of proactive measures to prevent such incidents and foster a safe and respectful work environment.
Title VII of the Civil Rights Act of 1964 is a federal law that prohibits employment discrimination based on race, color, religion, sex, and national origin. While sexual harassment is not explicitly mentioned in the text of Title VII, it has been widely recognized that sexual harassment falls under the prohibition of sex discrimination.
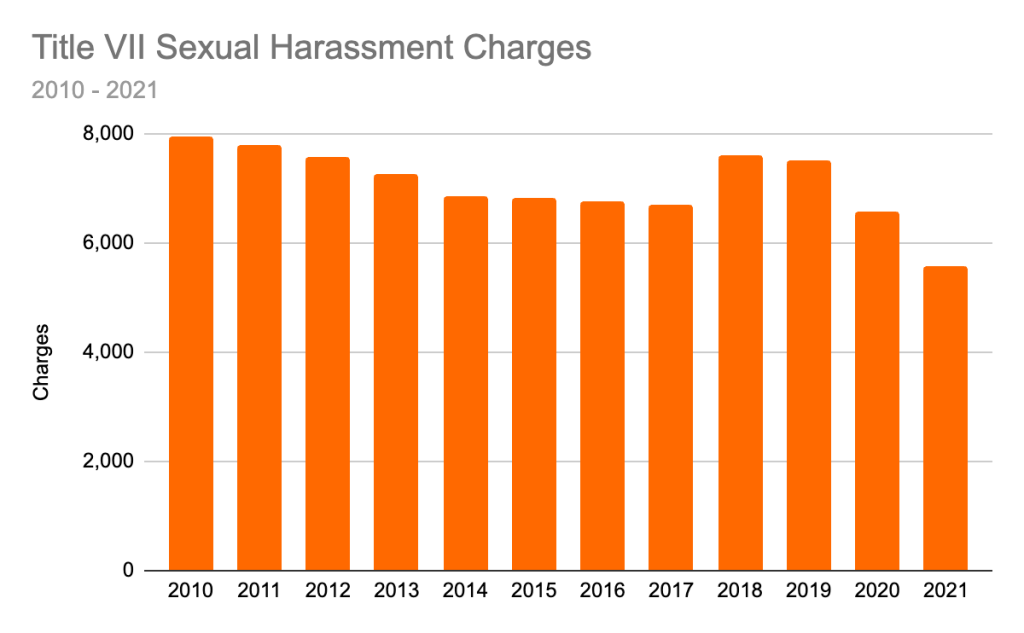
Under Title VII, employers are obligated to maintain a workplace that is free from sexual harassment. This means employers must take reasonable steps to prevent and promptly address incidents of sexual harassment, including establishing clear policies, providing training to employees, and implementing reporting and investigation procedures. Title VII also prohibits retaliation against individuals who report sexual harassment or participate in investigations related to such complaints.
In this study, we recorded, analyzed, and graphed workplace sexual harassment data across a range of categories from the years 1997 through 2021. Our data was provided by the Equal Employment Opportunity Commission.